

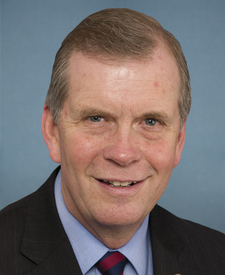
Tim Walberg
House · Republican · MI · MI05
- 31
- 728.000 $
- 01.06.2026
- 424,0
- 15
- +15,1%
- +21,5%
27 buys · 4 sells
ggü. SPY +2,7 pp · 12 Positionen
ggü. SPY +4,4 pp · 12 Positionen
Alerts on this filer's disclosures are not wired up yet. Adding their recent tickers to a watchlist works today.
Geschätztes Volumen nach Jahr
Geschätztes Portfolio
- AAPL 2 Geschäfte · zuletzt 7. Feb. 2565.000 $ 10,6%
- BA 2 Geschäfte · zuletzt 7. Feb. 2565.000 $ 10,6%
- BAC 2 Geschäfte · zuletzt 7. Feb. 2565.000 $ 10,6%
- CVX 2 Geschäfte · zuletzt 7. Feb. 2565.000 $ 10,6%
- ETN 2 Geschäfte · zuletzt 7. Feb. 2565.000 $ 10,6%
- LHX 2 Geschäfte · zuletzt 7. Feb. 25— —
- WFC 2 Geschäfte · zuletzt 7. Feb. 25— —
- CAT 2 Geschäfte · zuletzt 7. Feb. 25— —
- J 2 Geschäfte · zuletzt 7. Feb. 25— —
- XOM 1 Geschäfte · zuletzt 7. Feb. 25— —
- AMZN 2 Geschäfte · zuletzt 7. Feb. 25— —
- LMT 2 Geschäfte · zuletzt 7. Feb. 25— —
Positionen bis 01.06.2026
Sectors traded
| Sector | Trades |
|---|---|
| Industrials | 12 |
| Consumer Cyclical | 6 |
| Financial Services | 4 |
| Energy | 3 |
| Technology | 2 |
Disclosed trades
| Stock | Transaction | Traded | Filed · Tage bis Meldung | Size | |
|---|---|---|---|---|---|
| FSSL FS Specialty Lending Fund Common Shares of Beneficial Interest | Sold | 01.06.2026 | 03.06.2026 2 T | $15,001 - $50,000 | — |
| UA Under Armour, Inc. Class C Common Stock | Sold | 10.02.2026 | 03.06.2026 113 T Late | $1,001 - $15,000 | — |
| AMZN Amazon.com, Inc. - Common Stock | Bought | 07.02.2025 | 03.06.2026 481 T Late | $1,001 - $15,000 | -18,2% |
| AAPL Apple Inc. - Common Stock | Bought | 07.02.2025 | 03.06.2026 481 T Late | $15,001 - $50,000 | +19,3% |
| BAC Bank of America Corporation Common Stock | Bought | 07.02.2025 | 03.06.2026 481 T Late | $15,001 - $50,000 | +6,8% |
BA | Bought | 07.02.2025 | 03.06.2026 | $15,001 - $50,000 | — |
CAT | Bought | 07.02.2025 | 03.06.2026 | $15,001 - $50,000 | — |
CVX | Bought | 07.02.2025 | 03.06.2026 | $15,001 - $50,000 | — |
ETN | Bought | 07.02.2025 | 03.06.2026 | $15,001 - $50,000 | — |
XOM | Bought | 07.02.2025 | 03.06.2026 | $15,001 - $50,000 | — |
FSSL | Bought | 07.02.2025 | 03.06.2026 | $1,001 - $15,000 | — |
J | Bought | 07.02.2025 | 03.06.2026 | $15,001 - $50,000 | — |
LHX | Bought | 07.02.2025 | 03.06.2026 | $15,001 - $50,000 | — |
Sources House Clerk PTRs, Senate eFD filings and OGE 278-T reports, via community mirrors of the primary records
Return is the average move of that filer's disclosed purchases over the 90 days after each trade, equally weighted; vs SPY is that same average minus SPY, the S&P 500 ETF, over the same days. Both, and win rate, need at least five scored purchases, and all three are blank where we hold no price history for the stock. Volume is estimated from the disclosed amount brackets, which is the only figure a filing gives. Geschätzte Renditen sind hypothetisch: nur die offengelegten Positionen, bemessen an den Mittelwerten der Betragsspannen und je auf 30 % begrenzt, gegenüber SPY – nicht die tatsächliche Rendite der Person.
Wie wird das geschätzt?
Wir bauen das Portfolio aus den offengelegten Geschäften einer Politikerin oder eines Politikers nach. Ein Kauf geht zum Schlusskurs seines Transaktionstags ein, bemessen am Mittelwert der in der Meldung angegebenen Betragsspanne; ein Verkauf wird auf dieselbe Weise abgezogen. Die Tagesrenditen dieser Positionen werden verkettet, jede Position wird auf 30 % des Portfolios begrenzt, damit eine einzelne große Spanne nicht das gesamte Ergebnis bestimmt, und das Ganze wird über dieselben Tage mit SPY verglichen. Drei Dinge bleiben unsichtbar: Bestände, die vor dem Beginn unserer fünfjährigen Kurshistorie gekauft wurden, ob ein Verkauf eine Position ganz oder nur teilweise geschlossen hat, und jeder Wert, zu dem wir keine Kurshistorie haben. Bei weniger als drei bepreisbaren Positionen wird nichts angezeigt. Ein Politiker ohne offengelegte Trades innerhalb des Zeitraums wird mit „Bestand per …“ gekennzeichnet: Die Zahl zeigt, wie sich die zuletzt offengelegten Positionen entwickelt haben, und ist kein Beleg dafür, dass er sie noch hält. Wenn es gar keine Zahl gibt, sagt die Zelle warum: nur Verkäufe, alle Positionen verkauft, keine bewertbaren Positionen oder weniger als drei davon.
Built for investors who want to follow the money.
You do not need more headlines. You need to see where the money actually goes. Pro opens the full smart-money stack — congress trades, lobbying, federal contracts and backtested model strategies — and unblurs every table on the site.
- Follow the smart money
- Congress trades ranked by return, lobbying spend, federal contract awards, and model strategies with published backtests.
- Full tables, everywhere
- No blurred rows and no five-row previews. Screeners, politicians, hedge funds, insider filings and 13F holdings open in full.
- KI-Chat — 500.000 Tokens pro Monat inklusive
- Frag den Research-Chat zu jedem Ticker, Screener oder Filing. Jede Nachricht verbraucht, was das Modell liest und schreibt; der Zähler steht auf deiner Kontoseite.
- Watchlists and alerts without limits
- Free is capped at one watchlist and three active price alerts. Pro removes both caps and every trigger lands in your notification feed.